Comparing predicted UTRs
Philipp Ross
2018-09-25
Last updated: 2018-11-18
workflowr checks: (Click a bullet for more information)-
✖ R Markdown file: uncommitted changes
The R Markdown file has unstaged changes. To know which version of the R Markdown file created these results, you’ll want to first commit it to the Git repo. If you’re still working on the analysis, you can ignore this warning. When you’re finished, you can runwflow_publishto commit the R Markdown file and build the HTML. -
✔ Environment: empty
Great job! The global environment was empty. Objects defined in the global environment can affect the analysis in your R Markdown file in unknown ways. For reproduciblity it’s best to always run the code in an empty environment.
-
✔ Seed:
set.seed(12345)The command
set.seed(12345)was run prior to running the code in the R Markdown file. Setting a seed ensures that any results that rely on randomness, e.g. subsampling or permutations, are reproducible. -
✔ Session information: recorded
Great job! Recording the operating system, R version, and package versions is critical for reproducibility.
-
Great! You are using Git for version control. Tracking code development and connecting the code version to the results is critical for reproducibility. The version displayed above was the version of the Git repository at the time these results were generated.✔ Repository version: dd9d56a
Note that you need to be careful to ensure that all relevant files for the analysis have been committed to Git prior to generating the results (you can usewflow_publishorwflow_git_commit). workflowr only checks the R Markdown file, but you know if there are other scripts or data files that it depends on. Below is the status of the Git repository when the results were generated:
Note that any generated files, e.g. HTML, png, CSS, etc., are not included in this status report because it is ok for generated content to have uncommitted changes.Ignored files: Ignored: .Rhistory Ignored: .Rproj.user/ Ignored: analysis/.DS_Store Ignored: analysis/.httr-oauth Ignored: analysis/figure/ Ignored: code/.DS_Store Ignored: code/differential_expression/ Ignored: code/differential_phase/ Ignored: data/ Ignored: docs/.DS_Store Ignored: docs/figure/.DS_Store Ignored: docs/figure/neighboring_genes.Rmd/.DS_Store Ignored: output/compare/ Ignored: output/ctss_clustering/ Ignored: output/differential_detection/ Ignored: output/differential_expression/ Ignored: output/differential_phase/ Ignored: output/extensive_transcription/ Ignored: output/final_utrs/ Ignored: output/gcbias/ Ignored: output/homopolymer_analysis/ Ignored: output/neighboring_genes/ Ignored: output/promoter_architecture/ Ignored: output/tfbs_analysis/ Ignored: output/transcript_abundance/ Untracked files: Untracked: _workflowr.yml Untracked: docs/figure/tfbs_analysis.Rmd/ Untracked: figures/ Unstaged changes: Modified: README.md Modified: analysis/_site.yml Modified: analysis/about.Rmd Modified: analysis/analyze_neighboring_genes.Rmd Modified: analysis/array_correlations.Rmd Modified: analysis/calculate_transcript_abundance.Rmd Deleted: analysis/chunks.R Modified: analysis/comparing_utrs.Rmd Modified: analysis/ctss_clustering.Rmd Modified: analysis/dynamic_tss.Rmd Modified: analysis/extensive_transcription.Rmd Modified: analysis/final_utrs.Rmd Modified: analysis/gcbias.Rmd Modified: analysis/index.Rmd Modified: analysis/license.Rmd Modified: analysis/process_neighboring_genes.Rmd Modified: analysis/promoter_architecture.Rmd Modified: analysis/strain_differential_detection.Rmd Modified: analysis/strain_differential_expression.Rmd Modified: analysis/strain_differential_phase.Rmd Modified: analysis/tfbs_analysis.Rmd Modified: code/differential_detection/detect_transcripts.R Deleted: docs/Rplots.pdf
Expand here to see past versions:
| File | Version | Author | Date | Message |
|---|---|---|---|---|
| Rmd | 3e6a944 | Philipp Ross | 2018-09-25 | updated utr comparison |
| html | 3e6a944 | Philipp Ross | 2018-09-25 | updated utr comparison |
| html | c5562e7 | Philipp Ross | 2018-09-25 | updated utr comparison |
| Rmd | fa4fca8 | Philipp Ross | 2018-09-25 | added homopolymer analysis |
| Rmd | 1e6d9bb | Philipp Ross | 2018-09-24 | comparing UTRs |
| html | 1e6d9bb | Philipp Ross | 2018-09-24 | comparing UTRs |
Comparing different UTR and TSS predictions
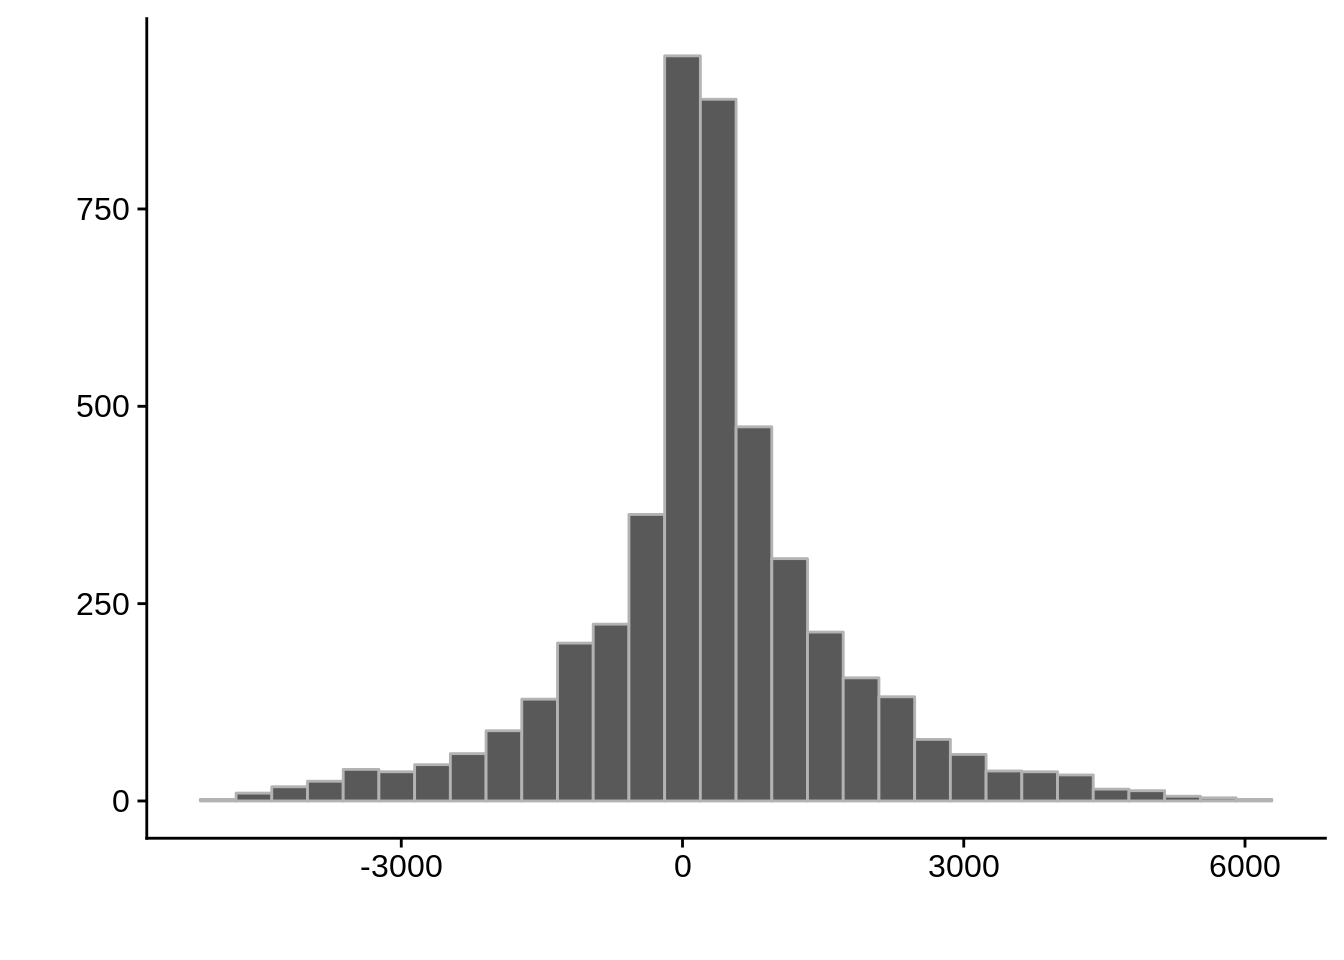
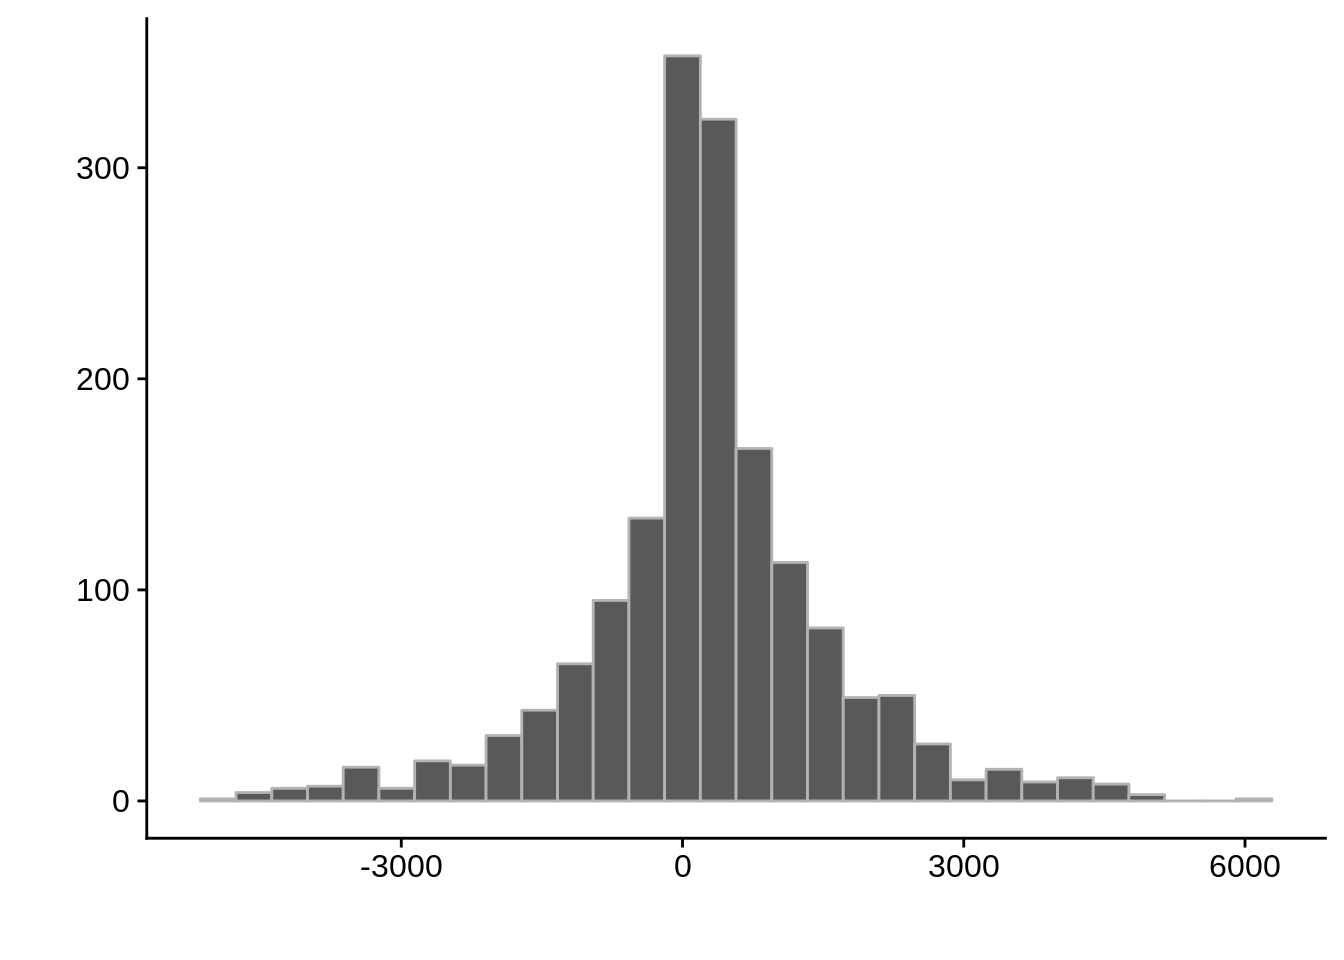
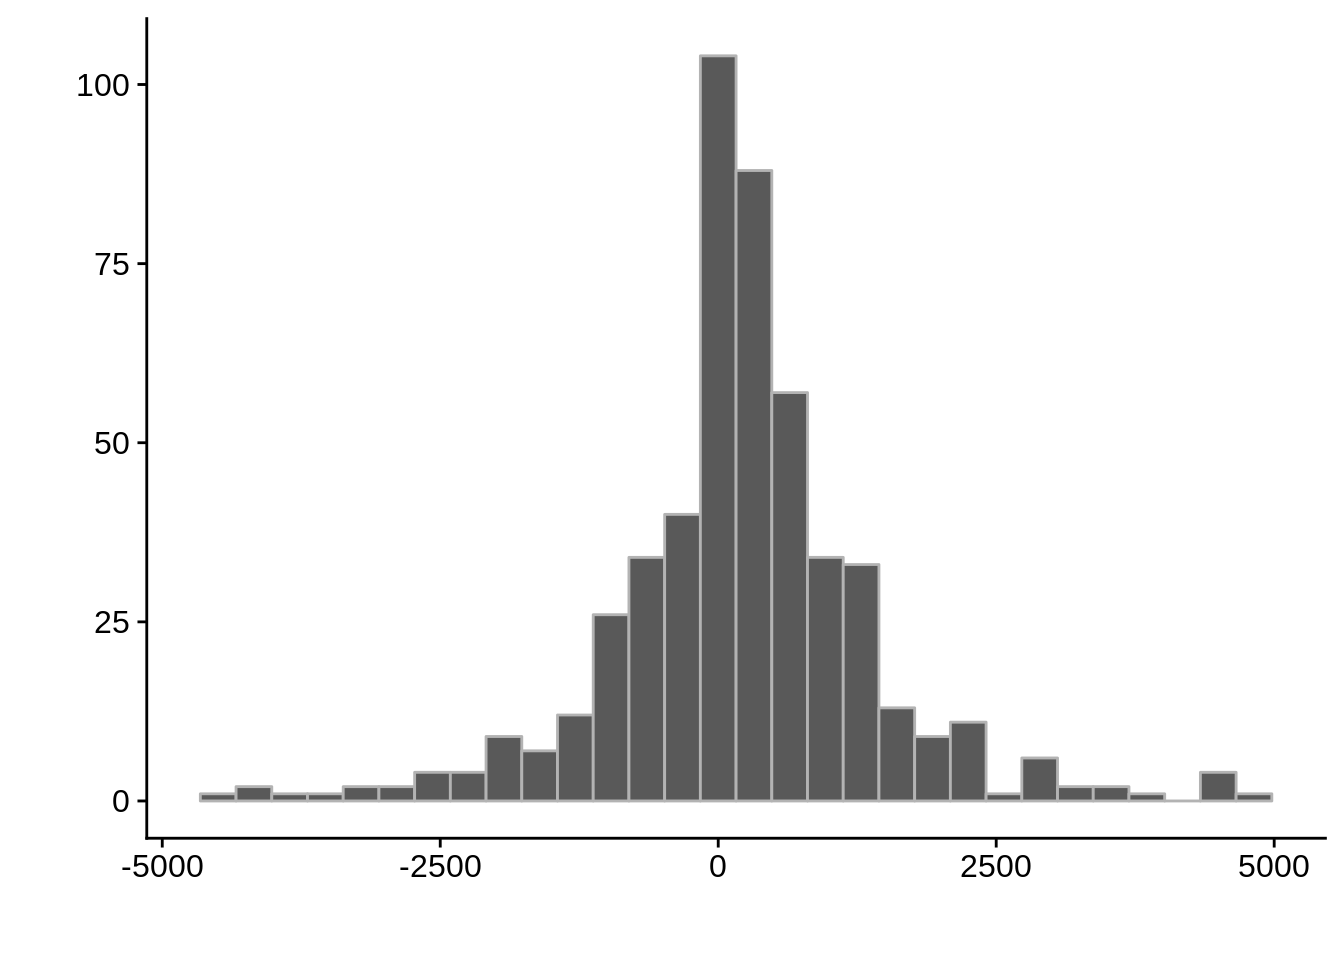
Since we were able to predict both UTRs and TSSs using our data, we wanted to know how our predictions compared to previously published predictions. Here, we compare the UTRs predicted in Caro et al. and Adjalley et al..
What we see is that although there are some large deviations, for the majority of 5UTR and TSS predictions, the results are not very different with a mean hovering around zero base pairs of difference between the start positions of our predicted 5’ UTRs and TSS and those that were previously published.
First, let’s import our 5UTR data:
Comparing to Caro et al.
# Comparing our UTR estimates to the Derisi predictions

derisi1 <- tibble::as_tibble(rtracklayer::import.bed("../data/compare_utrs/GSM1410291_UTRs_1.bed"))
derisi2 <- tibble::as_tibble(rtracklayer::import.bed("../data/compare_utrs/GSM1410292_UTRs_2.bed"))
derisi3 <- tibble::as_tibble(rtracklayer::import.bed("../data/compare_utrs/GSM1410293_UTRs_3.bed"))
derisi4 <- tibble::as_tibble(rtracklayer::import.bed("../data/compare_utrs/GSM1410294_UTRs_4.bed"))
derisi5 <- tibble::as_tibble(rtracklayer::import.bed("../data/compare_utrs/GSM1410295_UTRs_5.bed"))

fix_derisi_utrs <- function(set) {
  set$name <- stringi::stri_replace_last(set$name,replacement=" ",regex="_")
  set <- set %>% tidyr::separate(name,into = c("gene_id","type"), sep =" ")
  set$gene_id <- toupper(set$gene_id)
  out <- dplyr::inner_join(set, aliases, by=c("gene_id"="alias_symbol"))
  return(out)
}

derisi1 <- fix_derisi_utrs(derisi1)
derisi2 <- fix_derisi_utrs(derisi2)
derisi3 <- fix_derisi_utrs(derisi3)
derisi4 <- fix_derisi_utrs(derisi4)
derisi5 <- fix_derisi_utrs(derisi5)
Timepoint 1
tmp1 <- dplyr::select(derisi1, gene_id.y, width)
tmp2 <- dplyr::select(utrs, Parent, width)
compare_derisi <- dplyr::inner_join(tmp1,tmp2,by=c("gene_id.y"="Parent"))
rm(tmp1,tmp2)

g <- ggplot(compare_derisi,aes(width.x,width.y)) +
  geom_point() +
  geom_abline(color="red") +
  xlab("") +
  ylab("")

cowplot::save_plot(filename="../output/compare/derisi_scatter_1.png",plot=g)
cowplot::save_plot(filename="../output/compare/derisi_scatter_1.svg",plot=g)
print(g)
Expand here to see past versions of unnamed-chunk-4-1.png:
| Version | Author | Date |
|---|---|---|
| 3e6a944 | Philipp Ross | 2018-09-25 |
| 1e6d9bb | Philipp Ross | 2018-09-24 |
g <- ggplot(compare_derisi,aes(width.x-width.y)) +
  geom_histogram(color="grey70") +
  xlab("") +
  ylab("")

cowplot::save_plot(filename="../output/compare/derisi_histogram_1.png",plot=g)
cowplot::save_plot(filename="../output/compare/derisi_histogram_1.svg",plot=g)
print(g)
Expand here to see past versions of unnamed-chunk-4-2.png:
| Version | Author | Date |
|---|---|---|
| 1e6d9bb | Philipp Ross | 2018-09-24 |
    Pearson's product-moment correlation

data:  compare_derisi$width.x and compare_derisi$width.y
t = 44.624, df = 7619, p-value < 2.2e-16
alternative hypothesis: true correlation is not equal to 0
95 percent confidence interval:
 0.4372115 0.4728149
sample estimates:
      cor
0.4551951 gene_id.y width.x width.y diff
Length:7621 Min. : 0.0 Min. : 2 Min. :-5101.00
Class :character 1st Qu.: 221.0 1st Qu.: 281 1st Qu.: -328.00
Mode :character Median : 498.0 Median : 513 Median : -37.00
Mean : 610.5 Mean : 674 Mean : -63.45
3rd Qu.: 810.0 3rd Qu.: 895 3rd Qu.: 196.00
Max. :6810.0 Max. :5404 Max. : 5601.00 Timepoint 2
tmp1 <- dplyr::select(derisi2, gene_id.y, width)
tmp2 <- dplyr::select(utrs, Parent, width)
compare_derisi <- dplyr::inner_join(tmp1,tmp2,by=c("gene_id.y"="Parent"))
rm(tmp1,tmp2)

g <- ggplot(compare_derisi,aes(width.x,width.y)) +
  geom_point() +
  geom_abline(color="red") +
  xlab("") +
  ylab("")

cowplot::save_plot(filename="../output/compare/derisi_scatter_2.png",plot=g)
cowplot::save_plot(filename="../output/compare/derisi_scatter_2.svg",plot=g)
print(g)
Expand here to see past versions of unnamed-chunk-5-1.png:
| Version | Author | Date |
|---|---|---|
| 3e6a944 | Philipp Ross | 2018-09-25 |
| 1e6d9bb | Philipp Ross | 2018-09-24 |
g <- ggplot(compare_derisi,aes(width.x-width.y)) +
  geom_histogram(color="grey70") +
  xlab("") +
  ylab("")

cowplot::save_plot(filename="../output/compare/derisi_histogram_2.png",plot=g)
cowplot::save_plot(filename="../output/compare/derisi_histogram_2.svg",plot=g)
print(g)
Expand here to see past versions of unnamed-chunk-5-2.png:
| Version | Author | Date |
|---|---|---|
| 1e6d9bb | Philipp Ross | 2018-09-24 |
    Pearson's product-moment correlation

data:  compare_derisi$width.x and compare_derisi$width.y
t = 39.839, df = 7926, p-value < 2.2e-16
alternative hypothesis: true correlation is not equal to 0
95 percent confidence interval:
 0.3899543 0.4266379
sample estimates:
     cor
0.408461 gene_id.y width.x width.y diff
Length:7928 Min. : 0.0 Min. : 2.0 Min. :-5111.0
Class :character 1st Qu.: 146.0 1st Qu.: 283.0 1st Qu.: -418.0
Mode :character Median : 428.0 Median : 518.0 Median : -93.0
Mean : 508.4 Mean : 675.7 Mean : -167.4
3rd Qu.: 690.2 3rd Qu.: 897.0 3rd Qu.: 120.0
Max. :8149.0 Max. :5404.0 Max. : 7725.0 Timepoint 3
tmp1 <- dplyr::select(derisi3, gene_id.y, width)
tmp2 <- dplyr::select(utrs, Parent, width)
compare_derisi <- dplyr::inner_join(tmp1,tmp2,by=c("gene_id.y"="Parent"))
rm(tmp1,tmp2)

g <- ggplot(compare_derisi,aes(width.x,width.y)) +
  geom_point() +
  geom_abline(color="red") +
  xlab("") +
  ylab("")

cowplot::save_plot(filename="../output/compare/derisi_scatter_3.png",plot=g)
cowplot::save_plot(filename="../output/compare/derisi_scatter_3.svg",plot=g)
print(g)
Expand here to see past versions of unnamed-chunk-6-1.png:
| Version | Author | Date |
|---|---|---|
| 3e6a944 | Philipp Ross | 2018-09-25 |
| 1e6d9bb | Philipp Ross | 2018-09-24 |
g <- ggplot(compare_derisi,aes(width.x-width.y)) +
  geom_histogram(color="grey70") +
  xlab("") +
  ylab("")

cowplot::save_plot(filename="../output/compare/derisi_histogram_3.png",plot=g)
cowplot::save_plot(filename="../output/compare/derisi_histogram_3.svg",plot=g)
print(g)
Expand here to see past versions of unnamed-chunk-6-2.png:
| Version | Author | Date |
|---|---|---|
| 1e6d9bb | Philipp Ross | 2018-09-24 |
    Pearson's product-moment correlation

data:  compare_derisi$width.x and compare_derisi$width.y
t = 40.612, df = 7201, p-value < 2.2e-16
alternative hypothesis: true correlation is not equal to 0
95 percent confidence interval:
 0.4127160 0.4503005
sample estimates:
      cor
0.4316956 gene_id.y width.x width.y diff
Length:7203 Min. : 0.0 Min. : 2 Min. :-5111.0
Class :character 1st Qu.: 346.5 1st Qu.: 289 1st Qu.: -268.0
Mode :character Median : 541.0 Median : 528 Median : 6.0
Mean : 655.6 Mean : 689 Mean : -33.4
3rd Qu.: 816.5 3rd Qu.: 912 3rd Qu.: 233.5
Max. :8229.0 Max. :5404 Max. : 7805.0 Timepoint 4
tmp1 <- dplyr::select(derisi4, gene_id.y, width)
tmp2 <- dplyr::select(utrs, Parent, width)
compare_derisi <- dplyr::inner_join(tmp1,tmp2,by=c("gene_id.y"="Parent"))
rm(tmp1,tmp2)

g <- ggplot(compare_derisi,aes(width.x,width.y)) +
  geom_point() +
  geom_abline(color="red") +
  xlab("") +
  ylab("")

cowplot::save_plot(filename="../output/compare/derisi_scatter_4.png",plot=g)
cowplot::save_plot(filename="../output/compare/derisi_scatter_4.svg",plot=g)
print(g)
Expand here to see past versions of unnamed-chunk-7-1.png:
| Version | Author | Date |
|---|---|---|
| 3e6a944 | Philipp Ross | 2018-09-25 |
| 1e6d9bb | Philipp Ross | 2018-09-24 |
g <- ggplot(compare_derisi,aes(width.x-width.y)) +
  geom_histogram(color="grey70") +
  xlab("") +
  ylab("")

cowplot::save_plot(filename="../output/compare/derisi_histogram_4.png",plot=g)
cowplot::save_plot(filename="../output/compare/derisi_histogram_4.svg",plot=g)
print(g)
Expand here to see past versions of unnamed-chunk-7-2.png:
| Version | Author | Date |
|---|---|---|
| 1e6d9bb | Philipp Ross | 2018-09-24 |
    Pearson's product-moment correlation

data:  compare_derisi$width.x and compare_derisi$width.y
t = 39.132, df = 7197, p-value < 2.2e-16
alternative hypothesis: true correlation is not equal to 0
95 percent confidence interval:
 0.3996269 0.4377261
sample estimates:
      cor
0.4188608 gene_id.y width.x width.y diff
Length:7199 Min. : 0.0 Min. : 2.0 Min. :-5111.000
Class :character 1st Qu.: 340.0 1st Qu.: 287.0 1st Qu.: -261.500
Mode :character Median : 549.0 Median : 523.0 Median : 15.000
Mean : 674.9 Mean : 682.7 Mean : -7.868
3rd Qu.: 855.5 3rd Qu.: 902.0 3rd Qu.: 262.500
Max. :7030.0 Max. :5404.0 Max. : 5821.000 Timepoint 5
tmp1 <- dplyr::select(derisi5, gene_id.y, width)
tmp2 <- dplyr::select(utrs, Parent, width)
compare_derisi <- dplyr::inner_join(tmp1,tmp2,by=c("gene_id.y"="Parent"))
rm(tmp1,tmp2)

g <- ggplot(compare_derisi,aes(width.x,width.y)) +
  geom_point() +
  geom_abline(color="red") +
  xlab("") +
  ylab("")

cowplot::save_plot(filename="../output/compare/derisi_scatter_5.png",plot=g)
cowplot::save_plot(filename="../output/compare/derisi_scatter_5.svg",plot=g)
print(g)
Expand here to see past versions of unnamed-chunk-8-1.png:
| Version | Author | Date |
|---|---|---|
| 3e6a944 | Philipp Ross | 2018-09-25 |
| 1e6d9bb | Philipp Ross | 2018-09-24 |
g <- ggplot(compare_derisi,aes(width.x-width.y)) +
  geom_histogram(color="grey70") +
  xlab("") +
  ylab("")

cowplot::save_plot(filename="../output/compare/derisi_histogram_5.png",plot=g)
cowplot::save_plot(filename="../output/compare/derisi_histogram_5.svg",plot=g)
print(g)
Expand here to see past versions of unnamed-chunk-8-2.png:
| Version | Author | Date |
|---|---|---|
| 1e6d9bb | Philipp Ross | 2018-09-24 |
    Pearson's product-moment correlation

data:  compare_derisi$width.x and compare_derisi$width.y
t = 29.152, df = 8625, p-value < 2.2e-16
alternative hypothesis: true correlation is not equal to 0
95 percent confidence interval:
 0.2801573 0.3185779
sample estimates:
     cor
0.299489 gene_id.y width.x width.y diff
Length:8627 Min. : 0.0 Min. : 2.0 Min. :-5111.0
Class :character 1st Qu.: 0.0 1st Qu.: 277.0 1st Qu.: -718.0
Mode :character Median : 0.0 Median : 508.0 Median : -415.0
Mean : 164.4 Mean : 660.9 Mean : -496.4
3rd Qu.: 63.0 3rd Qu.: 877.0 3rd Qu.: -189.0
Max. :13050.0 Max. :5404.0 Max. :12541.0 Comparing to Adjalley et al.
# Comparing our UTR estimates to the Adjalley predictions
adjalley <- tibble::as_tibble(rtracklayer::import.gff("../data/compare_utrs/sorted_Adjalley_Chabbert_TSSs.gff"))

for (i in 1:8) {
  adjalley_filtered <- adjalley %>%
    dplyr::mutate(position=(start+end)/2) %>%
    dplyr::filter(FilterSize>i)
  tmp1 <- dplyr::select(adjalley_filtered, AssignedFeat, position)
  tmp2 <- dplyr::select(utrs, Parent, start)
  compare_adjalley <- dplyr::inner_join(tmp1,tmp2,by=c("AssignedFeat"="Parent"))
  compare_adjalley %>% dplyr::mutate(diff=position-start) %>% summary() %>% print()
  g <- ggplot(compare_adjalley,aes(position-start)) +
    geom_histogram(color="grey70") +
    xlab("") +
    ylab("")
  cowplot::save_plot(filename=paste0("../output/compare/adjalley_histogram_",i,".png"),plot=g)
  cowplot::save_plot(filename=paste0("../output/compare/adjalley_histogram_",i,".svg"),plot=g)
  print(g)
}
AssignedFeat position start diff
Length:36663 Min. : 40331 Min. : 43094 Min. :-4992.0
Class :character 1st Qu.: 428840 1st Qu.: 427513 1st Qu.: -222.0
Mode :character Median : 836668 Median : 836849 Median : 292.0
Mean : 963933 Mean : 963522 Mean : 410.9
3rd Qu.:1305788 3rd Qu.:1305295 3rd Qu.: 1044.0
Max. :3253500 Max. :3253655 Max. :12155.0 AssignedFeat position start diff
Length:29055 Min. : 41434 Min. : 43094 Min. :-4967.0
Class :character 1st Qu.: 421766 1st Qu.: 421138 1st Qu.: -262.0
Mode :character Median : 824344 Median : 823912 Median : 328.5
Mean : 947811 Mean : 947361 Mean : 449.5
3rd Qu.:1282446 3rd Qu.:1282646 3rd Qu.: 1169.5
Max. :3236321 Max. :3231222 Max. :12155.0 
Expand here to see past versions of unnamed-chunk-9-1.png:
| Version | Author | Date |
|---|---|---|
| 1e6d9bb | Philipp Ross | 2018-09-24 |
 AssignedFeat          position           start              diff
 Length:29055       Min.   :  41434   Min.   :  43094   Min.   :-4967.0
 Class :character   1st Qu.: 421766   1st Qu.: 421138   1st Qu.: -262.0
 Mode  :character   Median : 824344   Median : 823912   Median :  328.5
                    Mean   : 947811   Mean   : 947361   Mean   :  449.5
                    3rd Qu.:1282446   3rd Qu.:1282646   3rd Qu.: 1169.5
Max. :3236321 Max. :3231222 Max. :12155.0 
Expand here to see past versions of unnamed-chunk-9-2.png:
| Version | Author | Date |
|---|---|---|
| 1e6d9bb | Philipp Ross | 2018-09-24 |
 AssignedFeat          position           start              diff
 Length:18268       Min.   :  41434   Min.   :  43094   Min.   :-4967.0
 Class :character   1st Qu.: 417702   1st Qu.: 417063   1st Qu.: -288.1
 Mode  :character   Median : 810819   Median : 811370   Median :  295.0
                    Mean   : 948485   Mean   : 948096   Mean   :  388.8
                    3rd Qu.:1286032   3rd Qu.:1286107   3rd Qu.: 1087.0
Max. :3207218 Max. :3207055 Max. :12155.0 
Expand here to see past versions of unnamed-chunk-9-3.png:
| Version | Author | Date |
|---|---|---|
| 1e6d9bb | Philipp Ross | 2018-09-24 |
 AssignedFeat          position           start              diff
 Length:10086       Min.   :  41434   Min.   :  43094   Min.   :-4957.5
 Class :character   1st Qu.: 417660   1st Qu.: 417063   1st Qu.: -247.5
 Mode  :character   Median : 811348   Median : 811370   Median :  291.0
                    Mean   : 940319   Mean   : 939934   Mean   :  385.0
                    3rd Qu.:1284996   3rd Qu.:1284735   3rd Qu.: 1034.4
Max. :3207218 Max. :3207055 Max. : 6628.0 
Expand here to see past versions of unnamed-chunk-9-4.png:
| Version | Author | Date |
|---|---|---|
| 1e6d9bb | Philipp Ross | 2018-09-24 |
 AssignedFeat          position           start              diff
 Length:4644        Min.   :  41434   Min.   :  43094   Min.   :-4948.5
 Class :character   1st Qu.: 397119   1st Qu.: 397397   1st Qu.: -259.5
 Mode  :character   Median : 766111   Median : 765911   Median :  244.8
                    Mean   : 934627   Mean   : 934337   Mean   :  289.9
                    3rd Qu.:1295386   3rd Qu.:1293965   3rd Qu.:  878.0
Max. :3207218 Max. :3207055 Max. : 6100.0 
Expand here to see past versions of unnamed-chunk-9-5.png:
| Version | Author | Date |
|---|---|---|
| 1e6d9bb | Philipp Ross | 2018-09-24 |
 AssignedFeat          position           start              diff
 Length:1665        Min.   :  58482   Min.   :  59727   Min.   :-4948.5
 Class :character   1st Qu.: 369837   1st Qu.: 368586   1st Qu.: -258.0
 Mode  :character   Median : 792528   Median : 792937   Median :  227.5
                    Mean   : 968848   Mean   : 968578   Mean   :  270.5
                    3rd Qu.:1357263   3rd Qu.:1357159   3rd Qu.:  845.0
Max. :2889297 Max. :2888660 Max. : 6100.0 
Expand here to see past versions of unnamed-chunk-9-6.png:
| Version | Author | Date |
|---|---|---|
| 1e6d9bb | Philipp Ross | 2018-09-24 |
 AssignedFeat          position           start              diff
 Length:511         Min.   :  83962   Min.   :  83928   Min.   :-4615.5
 Class :character   1st Qu.: 319338   1st Qu.: 318727   1st Qu.: -286.2
 Mode  :character   Median : 758262   Median : 758556   Median :  181.0
                    Mean   : 923067   Mean   : 922854   Mean   :  212.9
                    3rd Qu.:1302403   3rd Qu.:1301308   3rd Qu.:  740.0
Max. :2889297 Max. :2888660 Max. : 4699.5 
Expand here to see past versions of unnamed-chunk-9-7.png:
| Version | Author | Date |
|---|---|---|
| 1e6d9bb | Philipp Ross | 2018-09-24 |

Expand here to see past versions of unnamed-chunk-9-8.png:
| Version | Author | Date |
|---|---|---|
| 1e6d9bb | Philipp Ross | 2018-09-24 |
Session information
R version 3.5.0 (2018-04-23)
Platform: x86_64-pc-linux-gnu (64-bit)
Running under: Gentoo/Linux

Matrix products: default
BLAS: /usr/local/lib64/R/lib/libRblas.so
LAPACK: /usr/local/lib64/R/lib/libRlapack.so

locale:
 [1] LC_CTYPE=en_US.UTF-8       LC_NUMERIC=C
 [3] LC_TIME=en_US.UTF-8        LC_COLLATE=en_US.UTF-8
 [5] LC_MONETARY=en_US.UTF-8    LC_MESSAGES=en_US.UTF-8
 [7] LC_PAPER=en_US.UTF-8       LC_NAME=C
 [9] LC_ADDRESS=C               LC_TELEPHONE=C
[11] LC_MEASUREMENT=en_US.UTF-8 LC_IDENTIFICATION=C

attached base packages:
[1] parallel  stats4    stats     graphics  grDevices utils     datasets
[8] methods   base

other attached packages:
 [1] bindrcpp_0.2.2
 [2] gdtools_0.1.7
 [3] BSgenome.Pfalciparum.PlasmoDB.v24_1.0
 [4] BSgenome_1.48.0
 [5] rtracklayer_1.40.6
 [6] Biostrings_2.48.0
 [7] XVector_0.20.0
 [8] GenomicRanges_1.32.7
 [9] GenomeInfoDb_1.16.0
[10] org.Pf.plasmo.db_3.6.0
[11] AnnotationDbi_1.42.1
[12] IRanges_2.14.12
[13] S4Vectors_0.18.3
[14] Biobase_2.40.0
[15] BiocGenerics_0.26.0
[16] scales_1.0.0
[17] cowplot_0.9.3
[18] magrittr_1.5
[19] forcats_0.3.0
[20] stringr_1.3.1
[21] dplyr_0.7.6
[22] purrr_0.2.5
[23] readr_1.1.1
[24] tidyr_0.8.1
[25] tibble_1.4.2
[26] ggplot2_3.0.0
[27] tidyverse_1.2.1

loaded via a namespace (and not attached):
 [1] nlme_3.1-137                bitops_1.0-6
 [3] matrixStats_0.54.0          lubridate_1.7.4
 [5] bit64_0.9-7                 httr_1.3.1
 [7] rprojroot_1.3-2             tools_3.5.0
 [9] backports_1.1.2             R6_2.3.0
[11] DBI_1.0.0                   lazyeval_0.2.1
[13] colorspace_1.3-2            withr_2.1.2
[15] tidyselect_0.2.4            bit_1.1-14
[17] compiler_3.5.0              git2r_0.23.0
[19] cli_1.0.1                   rvest_0.3.2
[21] xml2_1.2.0                  DelayedArray_0.6.6
[23] labeling_0.3                digest_0.6.17
[25] Rsamtools_1.32.3            svglite_1.2.1
[27] rmarkdown_1.10              R.utils_2.7.0
[29] pkgconfig_2.0.2             htmltools_0.3.6
[31] rlang_0.2.2                 readxl_1.1.0
[33] rstudioapi_0.8              RSQLite_2.1.1
[35] bindr_0.1.1                 jsonlite_1.5
[37] BiocParallel_1.14.2         R.oo_1.22.0
[39] RCurl_1.95-4.11             GenomeInfoDbData_1.1.0
[41] Matrix_1.2-14               Rcpp_0.12.19
[43] munsell_0.5.0               R.methodsS3_1.7.1
[45] stringi_1.2.4               whisker_0.3-2
[47] yaml_2.2.0                  SummarizedExperiment_1.10.1
[49] zlibbioc_1.26.0             plyr_1.8.4
[51] grid_3.5.0                  blob_1.1.1
[53] crayon_1.3.4                lattice_0.20-35
[55] haven_1.1.2                 hms_0.4.2
[57] knitr_1.20                  pillar_1.3.0
[59] XML_3.98-1.16               glue_1.3.0
[61] evaluate_0.11               modelr_0.1.2
[63] cellranger_1.1.0            gtable_0.2.0
[65] assertthat_0.2.0            broom_0.5.0
[67] GenomicAlignments_1.16.0    memoise_1.1.0
[69] workflowr_1.1.1
This reproducible R Markdown analysis was created with workflowr 1.1.1